貸借対照表(B/S)
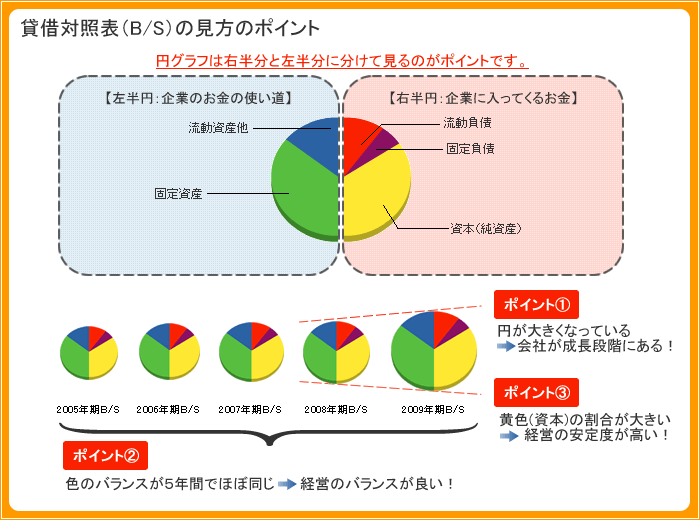
【左半円:企業のお金の使い道】 【右半円:企業に入ってくるお金】
円グラフにマウスをのせると項目を表示


| 決算年月日 | 2010年10月31日 | 2011年10月31日 | 2012年10月31日 |
|---|---|---|---|
| 流動資産他 | 34,117 |
33,205 |
47,063 |
| 固定資産 | 92,277 |
90,240 |
86,841 |
| 総資本 | 126,394 |
123,445 |
133,904 |
| 流動負債 | 17,509 |
25,216 |
30,242 |
| 固定負債 | 65,118 |
52,612 |
47,716 |
| 資本(純資産)合計 | 43,767 |
45,617 |
55,946 |
| 負債資本合計 | 126,394 |
123,445 |
133,904 |
※単位:千円
損益計算書(P/L)
【左半円:企業のお金の使い道】 【右半円:企業に入ってくるお金】
円グラフにマウスをのせると項目を表示


| 決算年月日 | 2010年10月31日 | 2011年10月31日 | 2012年10月31日 |
|---|---|---|---|
| 売上高 | 133,030 |
127,953 |
180,586 |
| 売上原価 | 90,840 |
92,765 |
118,984 |
| 売上総利益 | 42,190 |
35,188 |
61,602 |
| その他費用収益 | 37,090 |
32,923 |
35,601 |
| 経常利益 | 5,100 (3.8%) |
2,265 (1.8%) |
26,001 (14.4%) |
※単位:千円